

The Secret Model
The foreward responses from a Secret Model, called MT3DINV4S, are given below.You are welcome to invert single domain data (MT+Tipper, AS1 or AS2) and are encouraged to undertake Joint Inversion of MT+Tipper with either AS1 or AS2, or indeed all together.
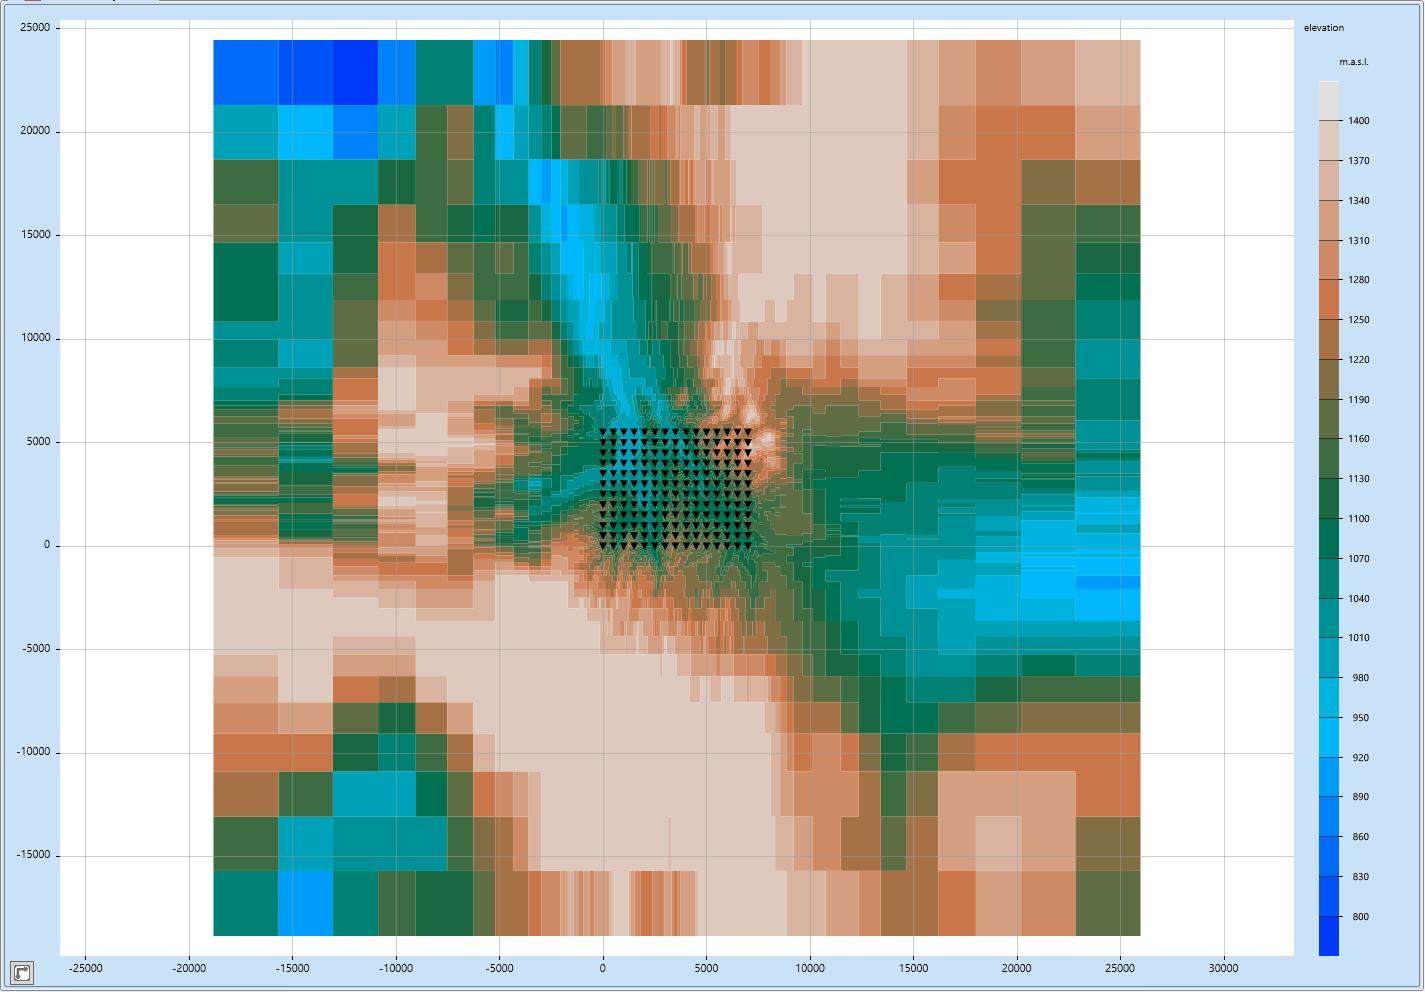
The data are defined on a rectangle of 7 km EW extent and 5.5 km NS extent.
Sites are at centres of the 25x25m rectangular cells at the surface, with the SW site at (-12.5,12.5) and the NE site at (6987.5,5512.5).
The forward E and H fields, on the surface and in the air (H fields only), were derived using Viridien's RLM-3D code of Randy Mackie.
NOTE: If anyone wants the E and H fields on the surface and the H fields in the air, rather than the responses,
please contact Alan Jones.
Topography
For the purpose of geographic location, the sites have been transposed assuming a UTM Zone of 12N. Thus the SW site at (-12.5,12.5) has latitude and longitude of (00:00:00.4068; -115:29:19.8750), which maps into the middle of the Pacific Ocean.*** DO NOT USE THE TOPOGRAPHY OF THAT LOCATION !!! ***
Download the elevation file here.
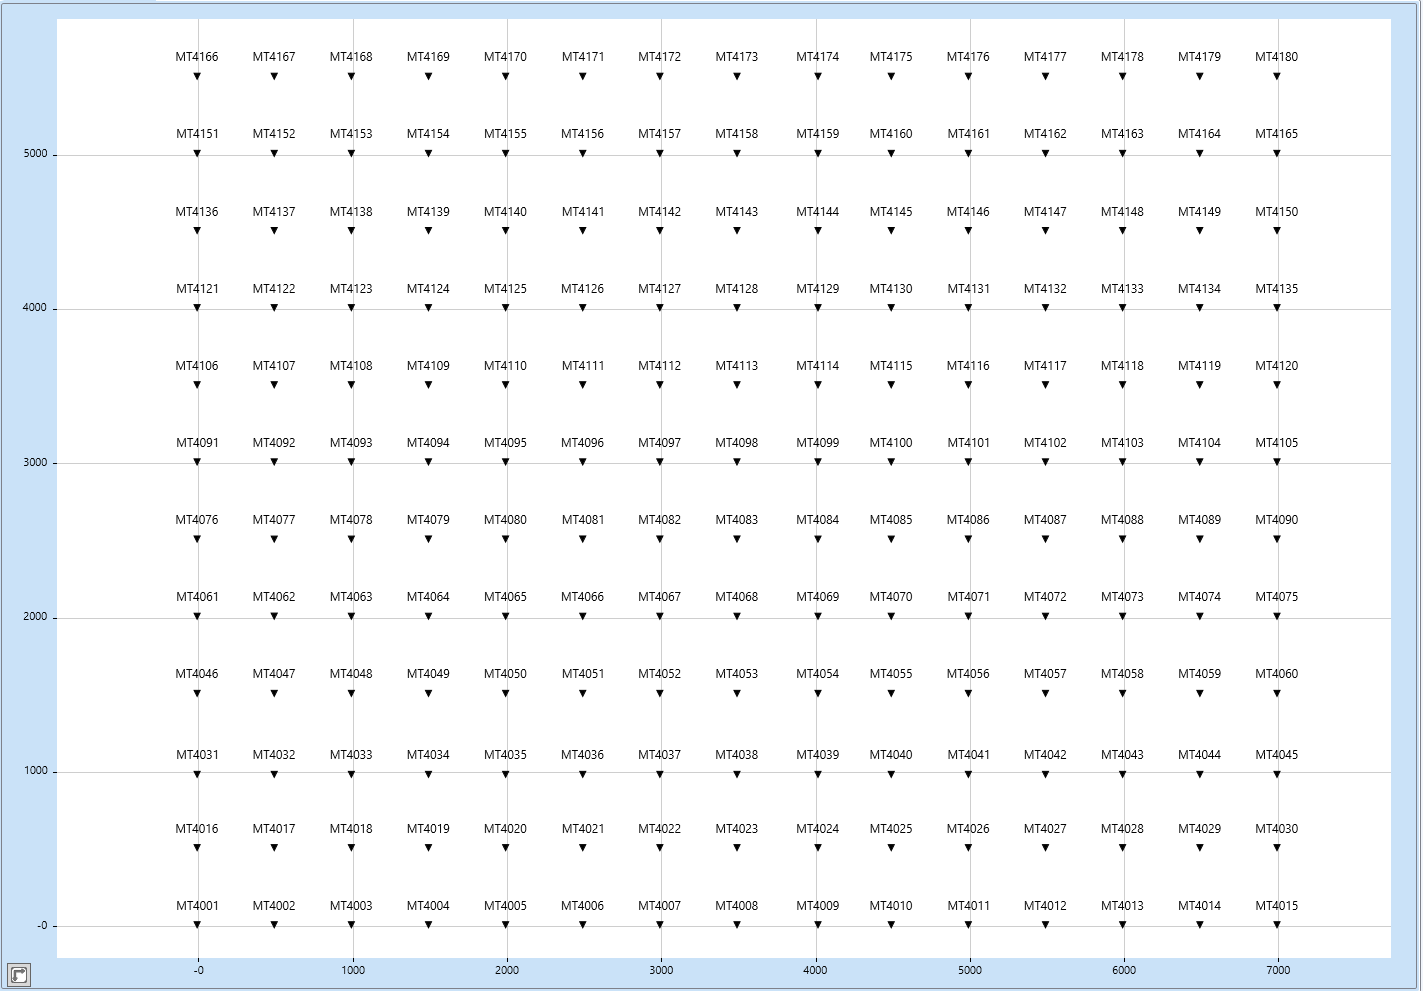
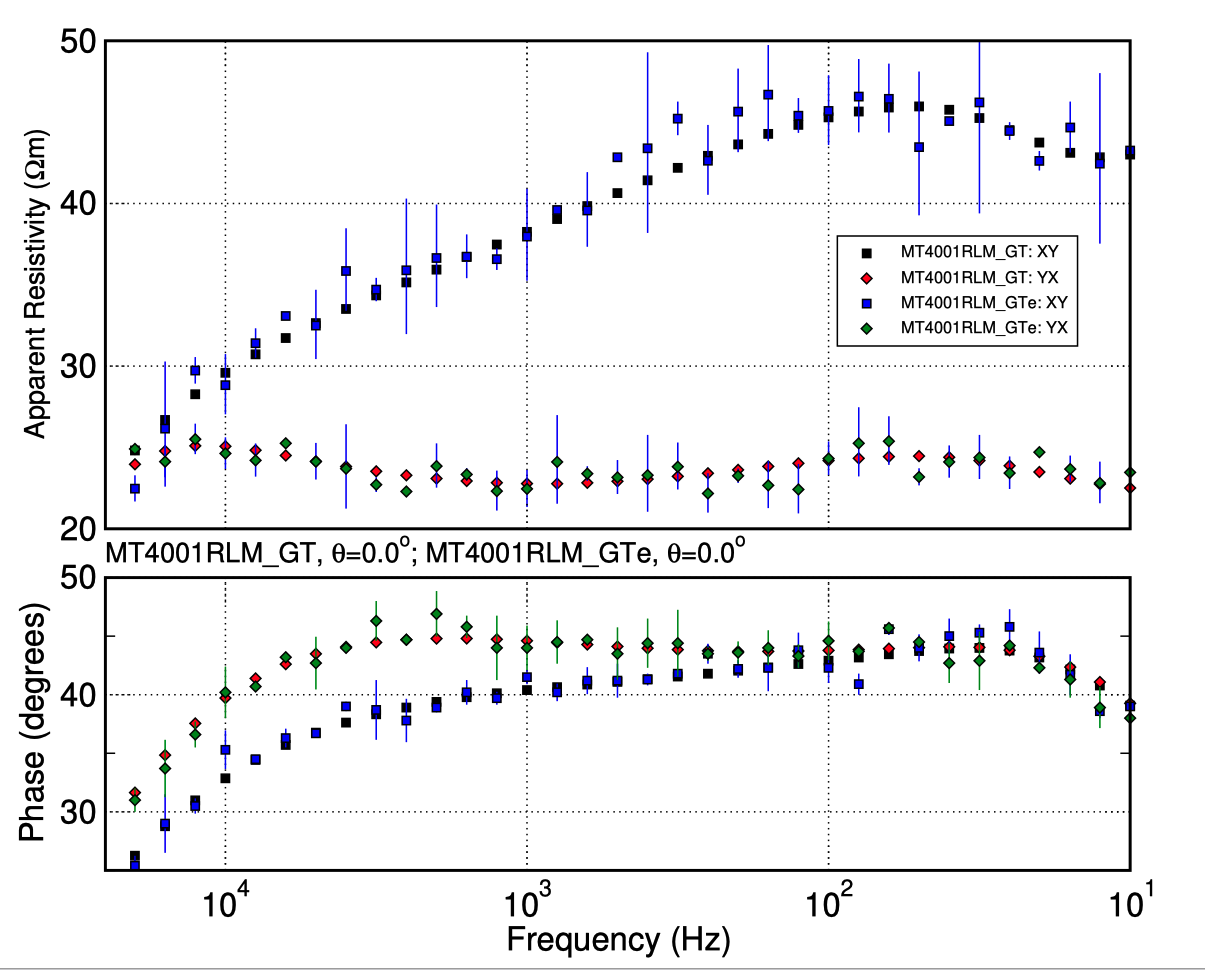
MT and Tipper data
For MT there are data at 180 sites on a 500x500 m grid, with 15 locations along the X-axis (EW), and 12 locations along the Y-axis (NS). The sites are labelled MT4001 to MT4180. The response estimates are at 35 frequencies, 10 per decade, from 25 kHz to 10 Hz. The total dataset is 180 sites x 35 frequencies x 12 data at each site/frequency (4 complex values in impedance tensor and 2 complex values in Tipper vector) = 75,600 data points. The data are provided in both EDI and J-format.For those who want to be adventurous, the data are provided as noise-free, and with 1.75% noise and scatter on the impedances and tippers added (equal to 3.56% in RhoA and 1deg in Pha). This is representative of high quality MT data.
Download the noise-free Secret Model MT and Tipper data in EDI format here.
Download the noise-free Secret Model MT and Tipper data in J-format here.
Download the noise-added Secret Model MT and Tipper data in EDI format here.
Download the noise-added Secret Model MT and Tipper data in J-format here.
Airborne Natural Source EM data
There has been a growth in airborne natural source EM (ANSEM) systems over the last two decades, all developed in Canada, namely:- the Z-Axis Tipper EM system (ZTEM) of Geotech Ltd.,
- the MobileMT system of Expert Geophysics Ltd., and
- the Quantum AMT (QAMT) system of Dias Geophysical Ltd.
The advantage of these systems is reconnaisance, which we need for rapid discovery of metals and minerals necessary to meet NetZero 2050 targets. The disadvantage is that they all record only the spatially-varying magnetic field in the air, whereas for many ore bodies some 80% of the anomalous EM fields is in the electric fields.
Many aspects of these airborne systems are confidential and proprietary, so we mimic them here with responses from three theoretical systems that have generally the same physical principles:
- AS1: Airborne system 1: Only Hz measured in the air, and related to horizontal H fields at the base station
- AS2: Airborne system 2: Measurement of all 3 components in the air (Hx, Hy, Hz), but without orientation, and related to base station horizontal electric fields
- AS3: Airborne system 3: Measurement of all 3 components in the air (Hx, Hy, Hz), with orientation, and related to base station horizontal electric and magnetic fields
These methods are discussed showing resolution properties for the Lalor deposit in northern Manitoba in a recent presentation by Jones here.
For the MT3DINV4 we will examine data from two of the three systems, namely AS1 and AS2. Note that the data files provided are NOT meant to replicate the data formats used by the companies, but rather to provide response estimates in easily accessible formats.
The data are provided at 281 locations along E-W profiles, with sampling interval of 25 m intervals, with a total of 56 profiles separated by 100 m for a total of 15,736 locations.
You are at liberty to downsample to 50 m intervals along profiles and 200 m between profiles to examine resolution properties.
The "bird" is at a height of 100 m above the ground.
AS1 data
AS1 Tipper data are derived at six frequencies, from 800 Hz to 25 Hz (replicating Geotech's approach), using airborne Hz related to ground base station (Hx,Hy). The data provided are the real and imaginary parts of the ZTEM tipper. The total dataset is 15,736 locations x 6 frequencies x 4 data at each location/frequency = 377,664 data points on 94,416 lines in the file.
The data format is: Site-ID, X-location (m), Y-location (m), Z-location (m), Frequency (Hz), Real(ZTEM Tzx), Imag(ZTEM Tzx), Real(ZTEM Tzy), Imag(ZTEM Tzy).
SiteID gives the profile number and the location number in the format LXXYYY, where XX is the profile and YYY is the location along the line.
There is a header line at the top of the file, so total number of lines in the file is 94,417.
Download the AS1 Tipper data here.
AS2 data
AS2 apparent conductivity data are derived at 22 frequencies, from 17 kHz to 25 Hz but without the AMT deadband frequencies (replicating Expert Geophysics' approach), using airborne (Hx,Hy,Hz) related to ground base station (Ex,Ey). The total dataset is 15,736 locations x 22 x 1 datum at each location/frequency frequencies = 346,192 data points.
There are a number of methods for computing the apparent conductivities at each location, and two sets of estimates are given here,
namely that of Sattel et al., (2019), and the cross-product.
For more information, see Prikhodko et al., (2025).
The units of the apparent conductivity data in both files are mS/m.
The data format is: SiteID, X-location (m), Y-location (m), Z-location (m), Frequency (Hz), Apparent conductivity (mS/m).
SiteID gives the profile number and the location number in the format LXXYYY, where XX is the profile and YYY is the location along the line.
There is a header line at the top of the file, so total number of lines in each file is 346,193.
Download the AS2 apparent conductivity data derived using Sattel's approach here.
Download the AS2 apparent conductivity data derived using the cross-product approach here.
Submitting your model and model results
Inversion model
Unfortunately, we as a community have failed to come together and agree on a universal model file format.
Here are some acceptable formats for the MT3DINV4:
- RLM: Randy Mackie format, for rectilinear meshes. Can be imported directly into Viridien's Geotools software package.
- UBC: UBC format. Can be imported directly into Geotools. Comprises two files, a 3D mesh file and a 3D model file.
- xyzv: An xyzv file is the most mesh-agnostic. Each xyzv points defines the centre of a cell at (x,y,z), of property value v. Two adjacent cells in X would have their boundary at (x1+x2)/2, same for Y and Z.
- Other formats may be added to this list.
Model responses
Please submit BOTH the data you inverted and the responses of your inversion model in EDI format.
Please include the following additional information in your submission email:
Type of code used (FD, FE, integral equation, etc.)
Computing time
Hardware details (CPU speed, memory, cluster specification)
Inversion parameters, including:
- Mesh dimensions
- Error floors assumed
- Regularization terms
- A detailed list of the inversion steps you used so what you did can be replicated by others using the same code on the same data
Discussion — Secret Model
Questions or comments? Sign in with GitHub to join the discussion.